김수빈 인턴 작성
Heatmap은 원래 사람의 체온분포를 나타내기 위해 사용되지만, 지리정보를 효과적으로 나타내기 위해 사용해보았다.
참고: https://csds.tistory.com/18
여기서 정제한 ‘seouldata.json’ 파일을 이용한다.
import csv
import pandas as pd
from lxml import etree
import os
import json

array = []
with open('seouldata.json', encoding='utf-8', mode='r') as f:
  array = json.load(f)

df = pd.DataFrame(array)

#None 이 아닌 데이터를 필터링
df = df[(df['x'] == df['x']) & (df['y'] == df['y'])].copy()
df['opnSvcNm'].value_counts().iloc[:20]
데이터를 정제하는 것 까지는 참고 링크의 내용과 같다.
df를 살펴보면 다음과 같다:

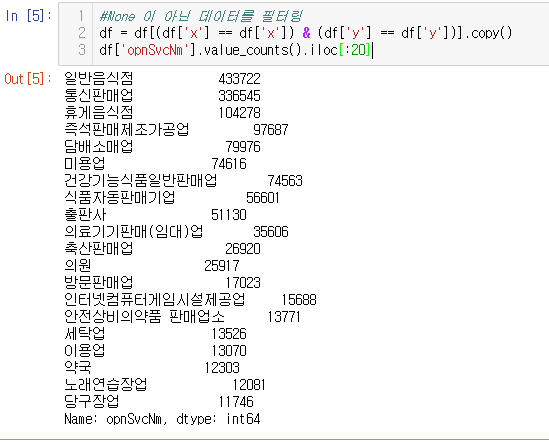
이 예시에서는 지도 상에 나타내려는 상권을 휴게음식점(카페, 등)으로 두었다.
HeatMapWithTime 은 특정지역의 시간에 따른 변화를 나타내는 역할을 하기 때문에, 공간과 시간, 이렇게 두 가지 축이 필요하다. 이 예시에서 공간은 서울특별시 성동구, 시간은 2000년 1월부터 2020년 12월까지 1달 간격으로 보여주도록 하자.
공간을 지정해줄 때는 df 에 있는 ‘lat’, ‘long’ 축을 이용한다. ‘lat’는 ‘latitude’(위도), ‘lng’는 ‘longitude’(경도) 를 의미한다.
우선 시간축을 담을 리스트를 만들어준다. df 의 날짜 형식이 yyyymmdd 이므로 이에 맞춰준다.
total_date = [[str(i) for i in range(j, j+1200, 100)] for j in range(20000100, 20210100, 10000)]
total_date2 = []
for i in total_date:
    total_date2.extend(i)
total_date2
그 다음 HeatMapWithTime으로 정제된 데이터들을 지도에 보여준다.
우선 원하는 지역의 위도, 경도로 범위를 지정해준다. temp_df 는 df 에서 우리가 보여주고 싶은 공간영역만 추출한 자료이다.
temp_df = df[(df['lng'] < 127.06223) & (df['lng'] > 127.02999)]
temp_df= temp_df[(temp_df['lat'] < 37.55190) & (temp_df['lat'] > 37.53393)]
그 다음 기본 지도를 깔아주고 지도가 처음 시작하는 위치를 지정해준다.
lat = temp_df['lat'].mean()
long = temp_df['lng'].mean()
sm = folium.Map([lat,long],zoom_start=15)
HeatMapWithTime에 넣어줄 heat_data 를 만들어야 한다.
heat_data = [[[row['lat'],row['lng']] for index, row in temp_df[((temp_df['apvPermYmd'] < i) & (temp_df['opnSvcNm'] == '휴게음식점')) & (((temp_df['dcbYmd'] == temp_df['dcbYmd']) & (temp_df['dcbYmd'] > str(int(i) + 100))) | (temp_df['dcbYmd'] != temp_df['dcbYmd']))].iterrows()] for i in total_date2]이 부분이 조금 헷갈린다. 차근 차근 쪼개서 보자면, 예를 들어 2020년 1월에 성동구에 있는 휴게음식점을 보고자 한다면 세 가지 조건이 있는데,
- 휴게음식점이어야 한다
- 2020년 1월보다 전에 음식점이 허가를 받았어야 한다
- 폐업이 되지 않거나 폐업이 되었더라도 2020년 2월 이후에 되었어야 한다
이를 정제해주는 것이 아래 코드이다.
temp_df[((temp_df['apvPermYmd'] < i) & (temp_df['opnSvcNm'] == '휴게음식점')) & (((temp_df['dcbYmd'] == temp_df['dcbYmd']) & (temp_df['dcbYmd'] > str(int(i) + 100))) | (temp_df['dcbYmd'] != temp_df['dcbYmd']))]이 부분은 temp_df에서 시간 영역에 맞는 휴게음식점들만 선별하는 과정이다. ‘apvPermYmd’ 는 음식점이 허가를 받은 날짜이고, ‘dcbYmd’ 는 음식점이 폐업한 날짜이다. 주의할 점은 폐업을 아직 하지 않은 음식점들은 ‘dcbYmd’ 가 None으로 되어 있고, 날짜와 비교할 때 에러가 날 수도 있다. 그래서 (temp_df['dcbYmd'] == temp_df['dcbYmd']) 를 통해 temp_df[‘dcbYmd’] 가 None 이 아닌 자료들은 날짜와 비교를 하지 않게끔 한다.
그리고 시간 기준이 되는 ‘i’ 는 미리 만들어준 total_date2 라는 리스트를 iterate하는 값이다.
heat_data를 다 만들어주었으면 그대로 HeatMapWithTime에 넣어주면 된다.
plugins.HeatMapWithTime(heat_data, index = total_date2).add_to(sm)
sm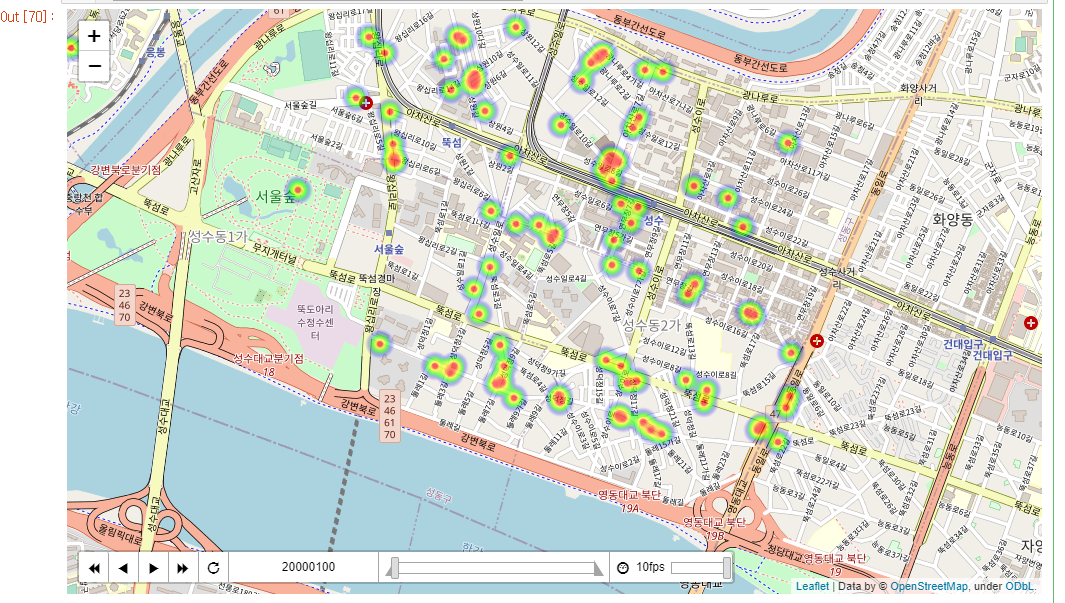
아래는 전체 코드이다.
 #성동구 전반, 휴게음식점
import folium
from folium import plugins
from folium.plugins import HeatMapWithTime

 #원하는 지역의 위도, 경도로 범위를 지정해준다.
temp_df = df[(df['lng'] < 127.06223) & (df['lng'] > 127.02999)]
temp_df= temp_df[(temp_df['lat'] < 37.55190) & (temp_df['lat'] > 37.53393)]

#지도가 처음 보여지는 기준점을 지정해준다.
lat = temp_df['lat'].mean()
long = temp_df['lng'].mean()
sm = folium.Map([lat,long],zoom_start=15)

heat_data = [[[row['lat'],row['lng']] for index, row in temp_df[((temp_df['apvPermYmd'] < i) & (temp_df['opnSvcNm'] == '휴게음식점')) & (((temp_df['dcbYmd'] == temp_df['dcbYmd']) & (temp_df['dcbYmd'] > str(int(i) + 100))) | (temp_df['dcbYmd'] != temp_df['dcbYmd']))].iterrows()] for i in total_date2]
plugins.HeatMapWithTime(heat_data, index = total_date2).add_to(sm)
sm'GIS Tech > GIS Data Process' 카테고리의 다른 글
| OpenStreetMap에서 POI 크롤링 (0) | 2024.06.03 |
|---|---|
| Useful Python GIS Skills 2 (0) | 2023.11.02 |
| 생활인구 시각화 (0) | 2021.01.22 |
| Python (GIS+General) Tip 모음 (5) | 2021.01.11 |
| 주요 좌표계 활용 방법 (TM, UTM-K, KATEC) (0) | 2021.01.11 |

댓글